Study Title: The impact of acoustic stimulation during sleep on memory and sleep architecture: A meta-analysis
Journal: Journal of Sleep Research
DOI: 10.1111/jsr.13385
Citations: 25
Summary: The meta-analysis by Stanyer et al. (2022) contains substantial data extraction errors (i.e., effect size calculation errors). Due to the severe data extraction errors and the meta-analytic results for memory retention are incorrect. The errors seem to reverse the results of the declarative memory part of this meta-analysis. The reported effects from the word-pair associate studies are 5x larger than the corrected effects (meta-analytic mean of corrected effects: d=0.19, mean of Stanyer et al. reported effects: d=0.98).
Brief study description
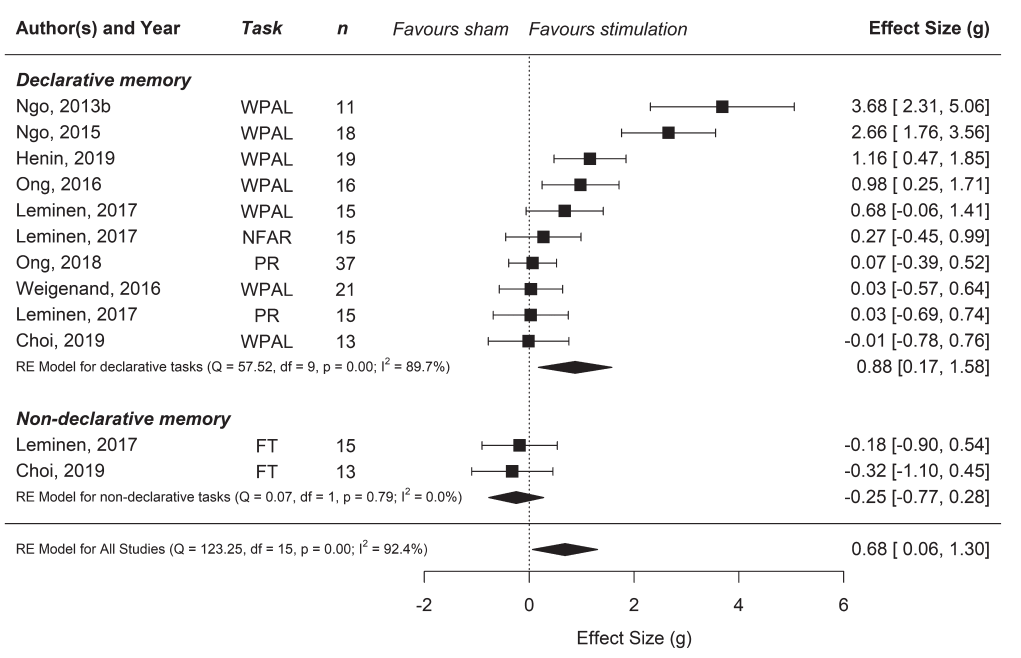
Meta-analysis of the efficacy of acoustic stimulation during slow-wave sleep on declarative memory performance. Each study compared memory retention between a stim (treatment) and sham (control) condition. This meta-analytic result appears in the abstract of the paper. Here we specifically look at the word-paired associates outcomes (WPAL).
The figure below comes from Stanyer et al. (2022) and contains all the errors. The declarative memory sub-group analysis shows a very large effect of d=0.88 [0.17, 1.58] (p<.001).
However, meta-analyses of the same effects show substantially different results (Harlow et al. 2023; Wunderlin et al. 2021). Since Harlow et al. (2023) and Wunderlin et al. (2021) have almost identical effect sizes, there is reason to believe that there are errors in Stanyer et al. (2022)’s effect size calculations. I co-authored the paper with Harlow et al. (2023) and there we laid out the calculations of the effect sizes and the discrepancies.
Reproducing effect sizes
The code below loads in the packages and the data set from Harlow et al. (2023). The column d_stanyer are the effects reported by Stanyer et al. (2022). This data base has all the means and standard deviations so that we can directly calculate effect sizes from them. Note that we have obtained the raw data from 7 of these studies and therefore we have a high degree of confidence in their exact effect size calculation.
library(metafor)library(ggplot2)library(tidyverse)library(readr)urlfile="https://raw.githubusercontent.com/MatthewBJane/meta_analyses/main/acoustic_stimulation_and_memory/data/meta_analytic_data.csv"# load data and remove unnecessary columnsdf <-read_csv(url(urlfile)) %>% dplyr::select(-day,-month,-year,-age,-doi,-sample_id,-study_id,-semantic,-word_count,-closed_loop,-whole_night,-blinding,-pfem,-methodological_deviations_from_ngo2013, -so_power, -n,-note) %>%# filter out studies after stanyerfilter(study !="Prehn-Kristensen et al.",study !="Harrington et al.") df
# A tibble: 11 × 10
      id study       eff_n Msham Mstim SDsham SDstim     r d_stanyer d_wunderlin
   <dbl> <chr>       <dbl> <dbl> <dbl>  <dbl>  <dbl> <dbl>     <dbl>       <dbl>
 1     1 Ngo et al.     11 13    22.2   8.23   7.53   0.7       3.68        1.07
 2     2 Ngo et al.     18 20.2  24.6   5.89   6.95   0.42      2.66        0.64
 3     3 Ong et al.     16 -1.72  0     4.16   3.76  NA         0.98        0.41
 4     4 Weigenand …    21 25.8  26.0   8.10   8.33   0.41      0.03        0.03
 5     5 Papalambro…    13  5.72 26.7  17.6   32.2    0.54     -0.35        0.77
 6     6 Leminen et…    15 15.6  21.1   8.1    7.7   NA         0.68        0.66
 7     7 Henin et a…    12 -2.42 -2.92  3.87   2.27  -0.25     NA          -0.15
 8     8 Henin et a…    19 24.3  23.8  12.3   12.2    0.75      1.16       -0.04
 9     9 Choi et al.    13  0.85  0     1.67   2.41  NA        -0.01       -0.29
10    12 Schneider …    17  8.35  5.29  4.97   6.39   0.25      0.61       -0.51
11    13 Diep et al.    24 -0.21 -0.17  0.294  0.343 NA         0.6         0.12
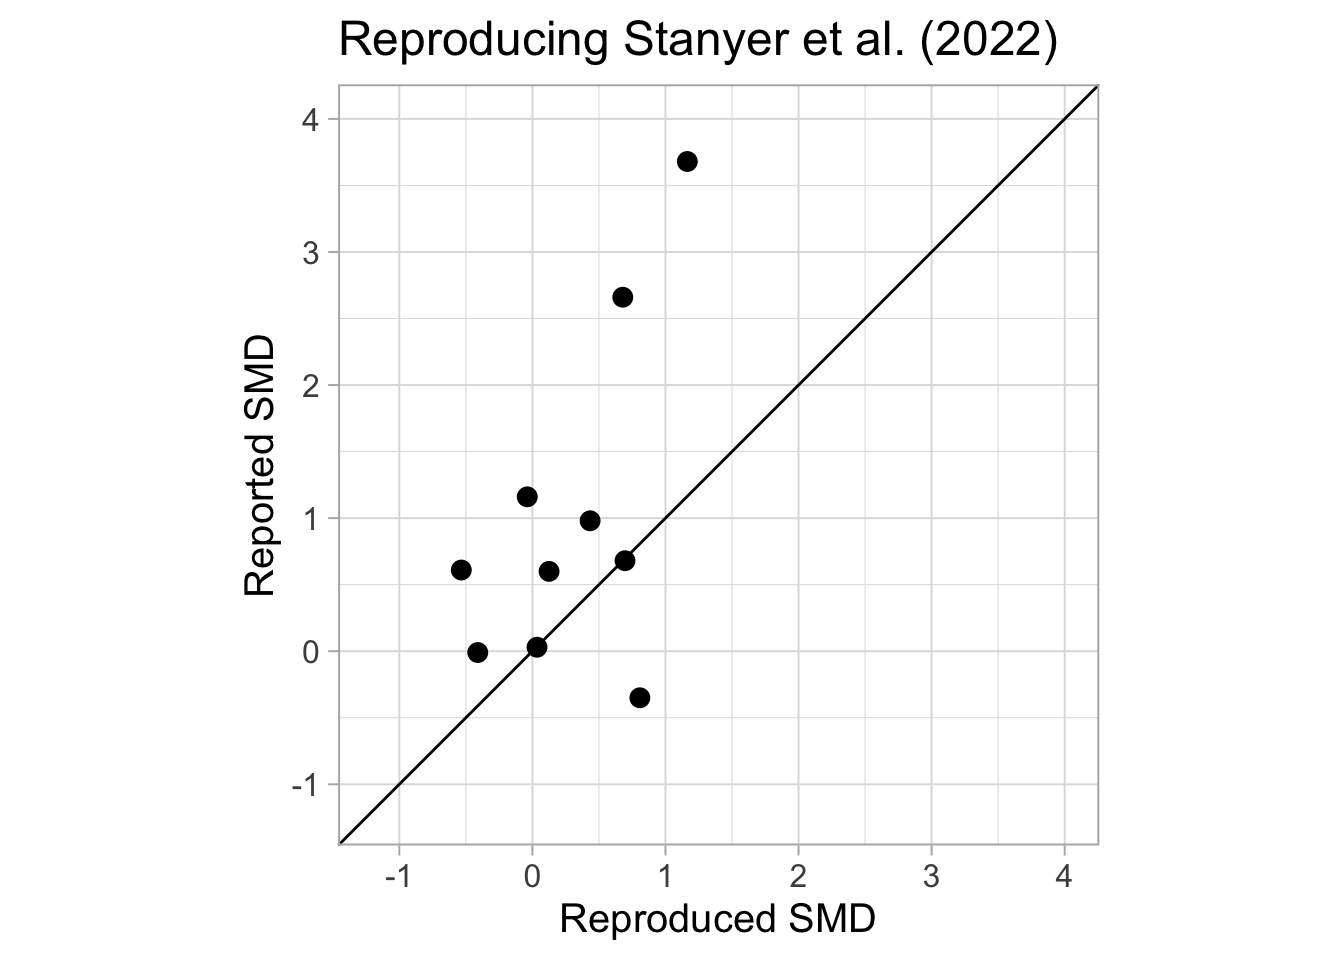
We can then visualize the discrepancies in effect sizes reported in Stanyer et al. (2022) as compared to our reproduced effect sizes.
Figure 1: Vertical axis shows the reproduced/recalculated effect sizes from the appropriate statistics and the horizontal axis shows the effect sizes reported by Stanyer et al. (2022). Most effects are above the line indicating that effects reported in Stanyer et al. (2022) are inflated.
Only two effects in the figure seem to line up on the horizontal line, whereas most effects appear above the line indicating inflated effects reported by Stanyer et al. (2022). The table below shows the reported and reproduced effects from the visualization. As we can see the (unweighted) mean effect size of the reported and reproduced effects are massively different (reported = 1.00, reproduced = 0.24) and the mean absolute difference is 0.95.
tinytable_2l9r8s8ume2t2r31mkum
Study
Reported
Reproduced
Abs.Difference
Ngo et al.
3.68
1.16
2.52
Ngo et al.
2.66
0.68
1.98
Ong et al.
0.98
0.43
0.55
Weigenand et al.
0.03
0.03
0.00
Papalambros et al.
-0.35
0.81
1.16
Leminen et al.
0.68
0.70
0.02
Henin et al.
-0.16
Henin et al.
1.16
-0.04
1.20
Choi et al.
-0.01
-0.41
0.40
Schneider et al.
0.61
-0.53
1.14
Diep et al.
0.60
0.13
0.47
Unweighted Mean
1.00
0.25
0.94
Meta-Analysis of Reproduced (Corrected) Effects vs. Reported Effects
I am going to use the implied variance formula from Stanyer et al. (2022) in order to keep the analysis as close as possible to their analysis to isolate the discrepancy in meta-analytic results to effect size errors. The corrected results are as follows
rma(data = df_rep, yi = d_stanyer, vi = var, method ="REML")
Warning: 1 study with NAs omitted from model fitting.
Random-Effects Model (k = 10; tau^2 estimator: REML)

tau^2 (estimated amount of total heterogeneity): 1.2487 (SE = 0.6614)
tau (square root of estimated tau^2 value):      1.1175
I^2 (total heterogeneity / total variability):   90.00%
H^2 (total variability / sampling variability):  10.00

Test for Heterogeneity:
Q(df = 9) = 68.0525, p-val < .0001

Model Results:

estimate      se    zval    pval   ci.lb   ci.ub
  0.9761  0.3747  2.6048  0.0092  0.2416  1.7105  **

---
Signif. codes:  0 '***' 0.001 '**' 0.01 '*' 0.05 '.' 0.1 ' ' 1
rma(data = df_rep, yi = d_stanyer_rep, vi = var, method ="REML")
Random-Effects Model (k = 11; tau^2 estimator: REML)

tau^2 (estimated amount of total heterogeneity): 0.0643 (SE = 0.0915)
tau (square root of estimated tau^2 value):      0.2535
I^2 (total heterogeneity / total variability):   31.31%
H^2 (total variability / sampling variability):  1.46

Test for Heterogeneity:
Q(df = 10) = 15.7422, p-val = 0.1073

Model Results:

estimate      se    zval    pval    ci.lb   ci.ub
  0.1902  0.1378  1.3805  0.1674  -0.0799  0.4603

---
Signif. codes:  0 '***' 0.001 '**' 0.01 '*' 0.05 '.' 0.1 ' ' 1
As we can see the meta-analysis of the Stanyer et al. (2022)’s reported WPAL effects is d=0.98 [0.24,1.71] (p=.009), whereas it is d=0.19 [0.08,0.46] (p=.167) for the corrected effects. This further shows that the effect sizes reported in Stanyer et al. (2022) are extremely inflated.
Through email correspondence with the editor of the journal and the authors they are both aware and agree with the errors. They also agreed to submit a correction. However, the initial correspondence was in August 2022 and even after following up, there still does not appear to be a correction.
Conclusion
This article needs a substantial correction as the errors reverse the one of the primary results of the paper.
References
Harlow, Tylor J, Matthew B Jané, Heather L Read, and James J Chrobak. 2023. “Memory Retention Following Acoustic Stimulation in Slow-Wave Sleep: A Meta-Analytic Review of Replicability and Measurement Quality.”Frontiers in Sleep 2: 1082253.
Stanyer, Emily C, Paul Dominick E Baniqued, Muhammad Awais, Layla Kouara, Andrew G Davies, Edward C Killan, and Faisal Mushtaq. 2022. “The Impact of Acoustic Stimulation During Sleep on Memory and Sleep Architecture: A Meta-Analysis.”Journal of Sleep Research 31 (3): e13385.
Wunderlin, Marina, Marc A Züst, Elisabeth Hertenstein, Kristoffer D Fehér, Carlotta L Schneider, Stefan Klöppel, and Christoph Nissen. 2021. “Modulating Overnight Memory Consolidation by Acoustic Stimulation During Slow-Wave Sleep: A Systematic Review and Meta-Analysis.”Sleep 44 (7): zsaa296.